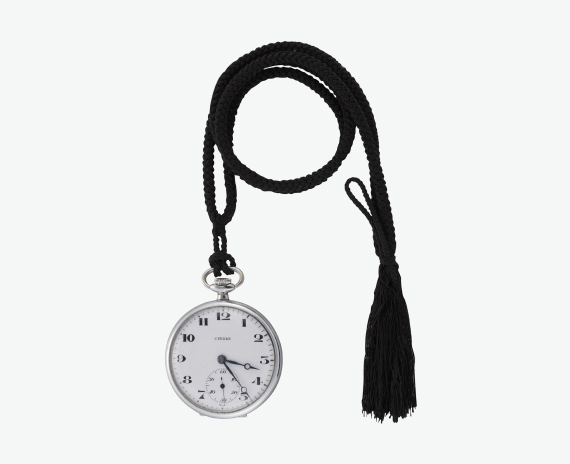
Watches
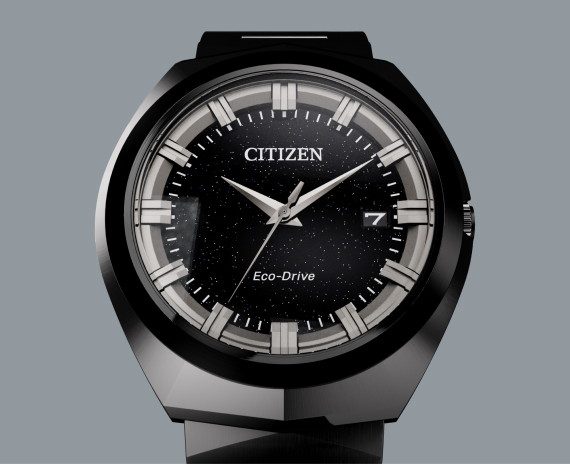
Here we outline our four businesses, through which we contribute widely to the lives of people around the world.
Machine tools
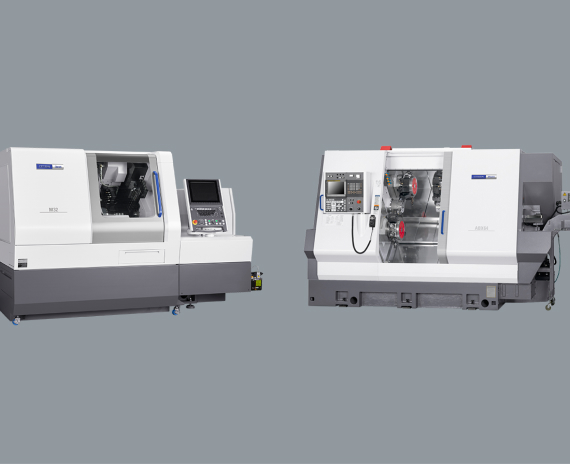
Citizen began production of machine tools in 1936, utilizing the technologies and know-how developed through the manufacture of watch parts. Our products contribute to the development of manufacturing industries all over the world.
Corporate Philosophy
Loved by citizens, working for citizens.
CITIZEN's corporate philosophy, "Loved by citizens, working for citizens" is to
deeply contribute to the lives of people around the world through the manufacturing of products that are loved and trusted by citizens.
Message From President & CEO
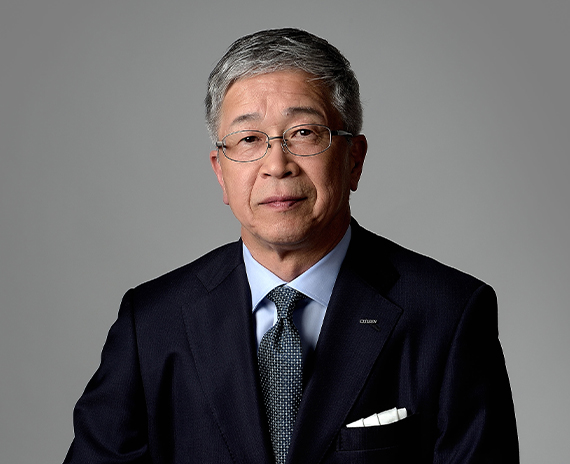
Crafting a new tomorrow Towards sustainable value creation
IR Library
CITIZEN REPORT(Integrated Report)
Top Management
By further promoting sustainable management, we aim to become a company that can create value sustainably
Sustainability Management
CITIZEN Group’s Sustainable Management
- TOP
- Sustainability
- ESG Data
ESG Data
- Environment
-
- The CITIZEN Group’s Environmental Impact Related to Climate Change
- The CITIZEN Group’s Environmental Impact Related to Energy
- The CITIZEN Group’s Environmental Impact related to Waste
- The CITIZEN Group’s Environmental Impact related to Water
- The CITIZEN Group’s Other Environmental Impacts (Including Environmental Pollution)
- Boundary
- Eco-Efficiency Indicators
- Costs related to the climate change response
- Costs related to water-related risks
- Costs related to pollution, waste, and resource use
- Environment-related accidents, violations, fines, etc.
- Environmental Data by Business Site
- Disclosure Information
- Social
Environment
- * Due to the revision of the calculation methods and figures, the figures may differ from those published in the past.
The CITIZEN Group’s Environmental Impact Related to Climate Change
Please scroll down to see→
| FY2018 | FY2019 | FY2020 | FY2021 | FY2022 | ||
|---|---|---|---|---|---|---|
| Scope 1 | Japan | 18,846 | 17,496 | 14,983 | 15,670 | 15,836 |
| Outside Japan | 3,246 | 2,267 | 1,787 | 2,713 | 2,651 | |
| Total | 22,092 | 19,763 | 16,770 | 18,383 | 18,487 | |
| Scope 2 (Location-based) |
Japan | 88,723 | 80,632 | 66,304 | 67,084 | 64,428 |
| Outside Japan | 70,192 | 62,143 | 54,234 | 61,475 | 56,403 | |
| Total | 158,914 | 142,775 | 120,538 | 128,559 | 120,830 | |
| Scope 1+Scope 2 (Location-based) |
Japan | 107,568 | 98,128 | 81,287 | 82,753 | 80,264 |
| Outside Japan | 73,437 | 64,410 | 56,021 | 64,188 | 59,054 | |
| Total | 181,006 | 162,538 | 137,308 | 146,941 | 139,318 | |
| Scope 2 (Market-based) |
Japan | 85,759 | 82,642 | 63,304 | 68,337 | 50,916 |
| Outside Japan | 71,657 | 63,443 | 56,049 | 60,402 | 53,752 | |
| Total | 157,416 | 146,084 | 119,353 | 128,739 | 104,669 | |
| Scope 1+ Scope 2 (Market-based) |
Japan | 104,605 | 100,138 | 78,286 | 84,007 | 66,753 |
| Outside Japan | 74,903 | 65,710 | 57,836 | 63,115 | 56,403 | |
| Total | 179,508 | 165,847 | 136,123 | 147,122 | 123,156 | |
Please scroll down to see→
| FY2018 | FY2019 | FY2020 | FY2021 | FY2022 | ||
|---|---|---|---|---|---|---|
| Scope 1+Scope 2 (Location-based) |
Japan and Outside Japan | 0.563 | 0.584 | 0.664 | 0.522 | 0.462 |
| Scope 1+Scope 2 (Market-based) |
Japan and Outside Japan | 0.558 | 0.595 | 0.659 | 0.523 | 0.409 |
- * Scope 1 includes the emission of greenhouse gases other than CO2
- * For Scope 2, location-based emission factors are calculated using the average value of the Ministry of the Environment's "Emission Factors by Electric Utility (for calculating greenhouse gas emissions by specific emitters)" for Japan and the IEA emissions factor 2022 for overseas.
Figures are recalculated using the latest factors, and therefore may differ from past published data. - * The emission factor for the Scope 2 market-base is based on the emission factor of the electricity menu used. However, in cases where the emission factor cannot be ascertained at overseas locations, the same emission factor as the location-based standard was used for the calculation.
Please scroll down to see→
| Category | FY2018 | FY2019 | FY2020 | FY2021 | FY2022 | |
|---|---|---|---|---|---|---|
| Category 1 | Purchased goods and services | 572,601 | 407,620 | 284,604 | 435,252 | 933,503 |
| Category 2 | Capital goods | 40,340 | 49,872 | 25,621 | 28,787 | 42,718 |
| Category 3 | Fuel- and energy related activities (not included in Scope 1 or Scope 2) | 34,078 | 22,561 | 19,657 | 21,559 | 20,678 |
| Category 4 | Upstream transportation and distribution | 33,474 | 27,173 | 19,710 | 37,095 | 39,300 |
| Category 5 | Waste generated in operations | 5,943 | 3,285 | 3,324 | 3,865 | 3,132 |
| Category 6 | Business travel | 2,243 | 2,208 | 2,004 | 1,766 | 1,740 |
| Category 7 | Employee commuting | 6,745 | 6,739 | 6,097 | 5,500 | 5,452 |
| Category 8 | Upstream leased assets | 113 | 113 | 99 | 205 | 224 |
| Category 9 | Downstream transportation and distribution | 3,294 | 2,478 | 2,127 | 4,488 | 4,257 |
| Category 10 | Processing of sold products | 11,309 | 9,337 | 6,687 | 26,906 | 16,239 |
| Category 11 | Use of sold products | 662,578 | 404,494 | 419,185 | 581,978 | 572,856 |
| Category 12 | End-of-life treatment of sold products | 777 | 664 | 683 | 1,117 | 849 |
| Category 13 | Downstream leased assets | - | - | - | - | |
| Category 14 | Franchise | - | - | - | - | |
| Category 15 | Investment | - | - | - | - | |
| Total | 1,373,493 | 936,545 | 789,799 | 1,148,517 | 1,640,948 | |
- * The data covers all The CITIZEN Group businesses.
- * The above Scope 3 emissions data for FY2019-FY2021 were verified by an external third-party verification organization.
Please scroll down to see→
| FY2018 | FY2019 | FY2020 | FY2021 | FY2022 | ||
|---|---|---|---|---|---|---|
| Methane | Japan | 131.0 | 158.2 | 146.6 | 129.7 | 98.3 |
| Overseas | - | - | - | - | 150.5 | |
| Total | 131.0 | 158.2 | 146.6 | 129.7 | 248.9 | |
| Nitrous oxide | Japan | 44.9 | 42.4 | 30.7 | 41.9 | 35.6 |
| Overseas | - | - | - | - | 62.6 | |
| Total | 44.9 | 42.4 | 30.7 | 41.9 | 98.2 | |
| Hydrofluorocarbons (HFC) | Japan | 87.9 | 21.6 | 84.0 | 283.9 | 633.8 |
| Overseas | - | - | - | - | 375.6 | |
| Total | 87.9 | 21.6 | 84.0 | 283.9 | 1009.4 | |
| Perfluorocarbons (PFC) | Japan | 0.0 | 0.0 | 0.0 | 43.2 | 30.3 |
| Overseas | - | - | - | - | 27.2 | |
| Total | 0.0 | 0.0 | 0.0 | 43.2 | 57.5 | |
| Sulfur hexafluoride (SF6) | Japan | 28.9 | 32.9 | 10.1 | 36.8 | 27.0 |
| Overseas | - | - | - | - | 0.0 | |
| Total | 28.9 | 32.9 | 10.1 | 36.8 | 27.0 | |
| Nitrogen trifluoride (NF3) | Japan | 0.0 | 0.0 | 0.0 | 0.0 | 0.0 |
| Overseas | - | - | - | - | 0.0 | |
| Total | 0.0 | 0.0 | 0.0 | 0.0 | 0.0 | |
| Carbon dioxide (CO2) from non-energy sources | Japan | - | - | - | - | 0.1 |
| Overseas | - | - | - | - | 0.7 | |
| Total | - | - | - | - | 0.8 | |
| Total | Japan | 292.6 | 255.2 | 271.4 | 535.5 | 825.1 |
| Overseas | - | - | - | - | 616.6 | |
| Total | 292.6 | 255.2 | 271.4 | 535.5 | 1441.7 | |
- * The above greenhouse gas emissions figures are based on domestic data only until FY2021.
- * Domestic emissions are higher than in previous years due to a revision of the calculation method from FY2022.
The CITIZEN Group’s Environmental Impact Related to Energy
Please scroll down to see→
| FY2018 | FY2019 | FY2020 | FY2021 | FY2022 | ||
|---|---|---|---|---|---|---|
| Total energy consumption | Japan | 989,562 | 950,405 | 811,221 | 838,409 | 811,043 |
| Outside Japan | 475,053 | 417,637 | 354,839 | 420,457 | 381,017 | |
| Total | 1,464,616 | 1,368,041 | 1,166,060 | 1,258,866 | 1,192,060 | |
- * Total energy consumption includes consumption of in-house generated renewable energy. Previously, electric energy was calculated as primary energy, but this has been changed to be published as consumed energy.
Please scroll down to see→
| FY2018 | FY2019 | FY2020 | FY2021 | FY2022 | |
|---|---|---|---|---|---|
| Japan and Outside Japan | 4.55 | 4.91 | 5.64 | 4.47 | 3.96 |
Please scroll down to see→
| FY2018 | FY2019 | FY2020 | FY2021 | FY2022 | ||
|---|---|---|---|---|---|---|
| Electricity consumption | Japan | 179,092 | 174,751 | 149,275 | 155,213 | 148,422 |
| Outside Japan | 118,277 | 106,273 | 90,912 | 105,175 | 97,052 | |
| Total | 297,368 | 281,024 | 240,187 | 260,388 | 245,474 | |
| of which electricity purchased | Japan | 178,876 | 174,529 | 148,998 | 154,928 | 148,109 |
| Outside Japan | 118,263 | 106,271 | 90,711 | 104,506 | 96,050 | |
| Total | 297,139 | 280,800 | 239,709 | 259,434 | 244,159 | |
| of which electricity purchased from renewable energy sources | Japan | 0 | 0 | 11,692 | 686 | 30,801 |
| Outside Japan | 7,714 | 6,395 | 3,730 | 7,203 | 10,074 | |
| Total | 7,714 | 6,395 | 15,422 | 7,889 | 40,875 | |
| of which renewable energy generation (excluding electricity sold) | Japan | 209 | 214 | 277 | 285 | 313 |
| Outside Japan | 0 | 0 | 200 | 660 | 1,002 | |
| Total | 209 | 214 | 477 | 945 | 1,314 | |
| Renewable electricity ratio (%) | Japan | 0.1% | 0.1% | 8.0% | 0.6% | 21.0% |
| Outside Japan | 6.5% | 6.0% | 4.3% | 7.5% | 11.4% | |
| Total | 2.7% | 2.4% | 6.6% | 3.4% | 17.2% | |
- * Total electricity consumption = Purchased electricity + Fossil fuel-generated + Renewable energy-generated
- * Renewable electricity ratio = (Amount of electricity purchased from renewable energy sources + Amount of renewable energy generated) / Total electricity consumed
Please scroll down to see→
| FY2018 | FY2019 | FY2020 | FY2021 | FY2022 | |
|---|---|---|---|---|---|
| Japan | 5,920 | 5,587 | 4,739 | 4,698 | 4,598 |
| Outside Japan | 119 | 120 | 92 | 139 | 123 |
Please scroll down to see→
| FY2018 | FY2019 | FY2020 | FY2021 | FY2022 | |
|---|---|---|---|---|---|
| Japan | 181 | 163 | 155 | 169 | 151 |
| Outside Japan | 207 | 126 | 86 | 171 | 135 |
The CITIZEN Group’s Environmental Impact related to Waste
Please scroll down to see→
| FY2018 | FY2019 | FY2020 | FY2021 | FY2022 | ||
|---|---|---|---|---|---|---|
| Total waste (waste and valuables) |
Japan | 6,718 | 6,423 | 4,844 | 5,090 | 5,188 |
| Outside Japan | 6,238 | 5,244 | 4,096 | 6,546 | 5,988 | |
| Total | 12,956 | 11,667 | 8,940 | 11,636 | 11,176 | |
| of which hazardous waste | Japan | - | - | 533 | 730 | 708 |
| Outside Japan | - | - | 50 | 60 | 89 | |
| Total | - | - | 583 | 789 | 798 | |
| Recycled waste | Japan | 6,673 | 6,395 | 4,834 | 5,080 | 5,178 |
| Outside Japan | 3,506 | 2,622 | 2,169 | 3,431 | 4,751 | |
| Total | 10,179 | 9,017 | 7,003 | 8,512 | 9,929 | |
| Recycling rate (%) | Japan | 99.3% | 99.6% | 99.8% | 99.8% | 99.8% |
| Outside Japan | 56.2% | 50.0% | 53.0% | 52.4% | 79.3% | |
| Total | 78.6% | 77.3% | 78.3% | 73.1% | 88.8% | |
- * Hazardous wastes are those that fall under the classification of specially controlled industrial waste in Japan's Waste Disposal Law.
- * The total amount of thermal, material, and chemical recycling is considered to be the amount of recycled waste.
Please scroll down to see→
| FY2018 | FY2019 | FY2020 | FY2021 | FY2022 | ||
|---|---|---|---|---|---|---|
| Land-filled | Japan | 6 | 15 | 7 | 9 | 8 |
| Outside Japan | 2,054 | 1,956 | 1,307 | 2,411 | 983 | |
| Incinerated without recycling | Japan | 39 | 12 | 4 | 1 | 1 |
| Outside Japan | 678 | 666 | 620 | 703 | 254 | |
Please scroll down to see→
| Type of waste | Japan | Outside Japan | Total | |
|---|---|---|---|---|
| Industrial waste | Sludge | 554 | 826 | 1,380 |
| Waste oil | 394 | 221 | 615 | |
| Waste acid and alkali | 726 | 42 | 768 | |
| Waste plastic | 231 | 76 | 307 | |
| Scrap metal | 47 | 341 | 388 | |
| Glass, ceramic, and rubber scraps | 8 | 16 | 25 | |
| Cinders and mineral scraps | 1 | 1,761 | 1,762 | |
| Mixtures and other industrial waste | 540 | 141 | 681 | |
| General waste | 291 | 1,398 | 1,689 | |
| Valuable resources | 2,395 | 1,166 | 3,561 | |
The CITIZEN Group’s Environmental Impact related to Water
Please scroll down to see→
| FY2018 | FY2019 | FY2020 | FY2021 | FY2022 | |
|---|---|---|---|---|---|
| Japan | 1,505 | 1,437 | 1,297 | 1,408 | 1,360 |
| Outside Japan | 1,005 | 796 | 712 | 714 | 612 |
| Total | 2,509 | 2,233 | 2,009 | 2,122 | 1,972 |
Please scroll down to see→
| FY2018 | FY2019 | FY2020 | FY2021 | FY2022 | ||
|---|---|---|---|---|---|---|
| Surface water | Japan | 0 | 1 | 1 | 1 | 0 |
| Groundwater (recyclable) | Japan | 590 | 562 | 546 | 583 | 640 |
| Third-party source (city water) | Japan | 473 | 443 | 399 | 410 | 381 |
| Third-party source (industrial water) | Japan | 240 | 231 | 158 | 216 | 199 |
| Total (Japan) | 1,303 | 1,237 | 1,104 | 1,209 | 1,220 | |
| Surface water | Outside Japan | 0 | 0 | 0 | 0 | 0 |
| Groundwater (recyclable) | Outside Japan | 10 | 4 | 2 | 4 | 2 |
| Third-party source (city water) | Outside Japan | 537 | 503 | 389 | 414 | 375 |
| Third-party source (industrial water) | Outside Japan | 375 | 210 | 256 | 233 | 185 |
| Total (outside Japan) | 922 | 717 | 648 | 651 | 563 | |
| Total | 2,225 | 1,954 | 1,751 | 1,860 | 1,783 | |
Please scroll down to see→
| FY2018 | FY2019 | FY2020 | FY2021 | FY2022 | |
|---|---|---|---|---|---|
| Japan | 202 | 200 | 194 | 198 | 140 |
| Outside Japan | 83 | 79 | 64 | 63 | 49 |
| Total | 285 | 279 | 258 | 261 | 189 |
Please scroll down to see→
| FY2018 | FY2019 | FY2020 | FY2021 | FY2022 | |
|---|---|---|---|---|---|
| Japan | 994 | 975 | 835 | 926 | 916 |
| Outside Japan | 583 | 428 | 376 | 365 | 368 |
| Total | 1,577 | 1,403 | 1,210 | 1,290 | 1,284 |
Please scroll down to see→
| FY2018 | FY2019 | FY2020 | FY2021 | FY2022 | ||
|---|---|---|---|---|---|---|
| Surface water | Japan | 517 | 508 | 468 | 492 | 493 |
| Third-party location | Japan | 477 | 467 | 366 | 433 | 423 |
| Total (Japan) | 994 | 975 | 835 | 926 | 916 | |
| Surface water | Outside Japan | 12 | 9 | 7 | 9 | 8 |
| Third-party location | Outside Japan | 571 | 419 | 369 | 355 | 360 |
| Total (outside Japan) | 583 | 428 | 376 | 365 | 368 | |
| Total | 1,577 | 1,403 | 1,210 | 1,290 | 1,284 | |
Please scroll down to see→
| FY2018 | FY2019 | FY2020 | FY2021 | FY2022 | |
|---|---|---|---|---|---|
| Japan | 25.4 | 26.4 | 14.4 | 8.3 | 14.6 |
| Outside Japan | 6.6 | 8.9 | 7.4 | 50.7 | 97.5 |
Please scroll down to see→
| FY2018 | FY2019 | FY2020 | FY2021 | FY2022 | |
|---|---|---|---|---|---|
| Japan | 6.9 | 6.3 | 3.6 | 9.5 | 5.5 |
| Outside Japan | 19.6 | 30.1 | 33.7 | 13.9 | 37.4 |
The CITIZEN Group’s Other Environmental Impacts (Including Environmental Pollution)
Please scroll down to see→
| FY2018 | FY2019 | FY2020 | FY2021 | FY2022 | |
|---|---|---|---|---|---|
| Japan | 4.0 | 3.0 | 2.6 | 2.1 | 1.4 |
Please scroll down to see→
| FY2018 | FY2019 | FY2020 | FY2021 | FY2022 | |
|---|---|---|---|---|---|
| Japan | 0.0 | 0.0 | 0.0 | 0.1 | 0.1 |
Please scroll down to see→
| FY2018 | FY2019 | FY2020 | FY2021 | FY2022 | |
|---|---|---|---|---|---|
| Japan | 196 | 184 | 147 | 145 | 125 |
- * The amount of PRTR substances handled is based on amounts of 100 kg or more used per year at each business site.
- * Since some substances were not included in the past data, they were added back in the data and the figures were recalculated.
Please scroll down to see→
| Chemical Substances Subject to the PRTR Act | Handled amount | Discharged amount | Transferred amount | ||||
|---|---|---|---|---|---|---|---|
| Discharged into the atmosphere | Discharged into public water bodies | Discharged into the soil at the sites | Land-filled at the sites | Transferred to sewers | Transferred off-site | ||
| Chromium and trivalent chromium compounds | 39.28 | 0.00 | 0.00 | 0.00 | 0.00 | 0.00 | 0.00 |
| 1-bromopropane | 21.71 | 16.49 | 0.00 | 0.00 | 0.00 | 0.00 | 0.00 |
| 1,2,4-trimethylbenzene | 14.06 | 0.05 | 0.00 | 0.00 | 0.00 | 0.00 | 1.20 |
| Xylene | 12.04 | 0.05 | 0.00 | 0.00 | 0.00 | 0.00 | 1.37 |
| Nickel | 5.84 | 0.00 | 0.00 | 0.00 | 0.00 | 0.00 | 0.02 |
| Lead | 5.62 | 0.00 | 0.00 | 0.00 | 0.00 | 0.00 | 0.00 |
| Manganese and its compounds | 5.50 | 0.00 | 0.00 | 0.00 | 0.00 | 0.00 | 0.00 |
| Hydrogen fluoride and its water-soluble salts | 5.34 | 0.04 | 0.18 | 0.00 | 0.00 | 0.00 | 0.00 |
| Nickel compounds | 3.64 | 0.00 | 0.00 | 0.00 | 0.00 | 0.00 | 0.38 |
| Methylnaphthalene | 3.16 | 0.00 | 0.00 | 0.00 | 0.00 | 0.00 | 0.00 |
| Toluene | 1.89 | 0.00 | 0.00 | 0.00 | 0.00 | 0.00 | 0.00 |
| Inorganic cyanide compounds (excluding complex salts and cyanates) |
1.78 | 0.00 | 0.01 | 0.00 | 0.00 | 0.00 | 1.16 |
| Others | 4.80 | 0.13 | 0.02 | 0.00 | 0.00 | 0.00 | 0.33 |
| Total | 124.66 | 16.74 | 0.15 | 0.00 | 0.00 | 0.00 | 4.46 |
Please scroll down to see→
| FY2018 | FY2019 | FY2020 | FY2021 | FY2022 | |
|---|---|---|---|---|---|
| Outside Japan | 1,250 | 1,070 | 924 | 1,346 | 1,231 |
Please scroll down to see→
| FY2018 | FY2019 | FY2020 | FY2021 | FY2022 | |
|---|---|---|---|---|---|
| Japan | 37.0 | 33.7 | 27.8 | 17.4 | 16.6 |
| Outside Japan | - | - | - | - | 37.6 |
| Total | 37.0 | 33.7 | 27.8 | 17.4 | 54.2 |
- * VOC emissions in Japan are calculated by substituting atmospheric emissions of substances Subject to the PRTR Act.
Please scroll down to see→
| FY2018 | FY2019 | FY2020 | FY2021 | FY2022 | |
|---|---|---|---|---|---|
| Japan | 521 | 555 | 310 | 273 | 283 |
| Outside Japan | 1,337 | 1,104 | 661 | 481 | 621 |
Please scroll down to see→
| FY2018 | FY2019 | FY2020 | FY2021 | FY2022 | |
|---|---|---|---|---|---|
| Japan | 75 | 71 | 45 | 43 | 44 |
| Outside Japan | 43 | 45 | 34 | 19 | 36 |
Boundary
- Japan
-
- CITIZEN WATCH / CITIZEN MACHINERY / CITIZEN ELECTRONICS / CITIZEN FINEDEVICE / CITIZEN SYSTEMS JAPAN / CITIZEN WATCH MANUFACTURING / CITIZEN T.I.C. / CITIZEN MICRO / FUJIMI / CITIZEN ELECTRONICS TIMEL /CITIZEN CHIBA PRECISION / CITIZEN LOGISTICS SERVICE
- Target period: April 1, 2022 ‒ March 31, 2023
- Outside Japan
-
- ROYAL TIME CITI CO., LTD. / GUANGZHOU MOST CROWN ELECTRONICS / CITIZEN MACHINERY ASIA / CITIZEN MACHINERY PHILIPPINES / CITIZEN MACHINERY VIETNAM / CITIZEN CHINA PRECISION MACHINERY / JIANGXING ELECTRONICS LTD. / CITIZEN SYSTEMS (JIANGMEN) / MASTER CROWN ELECTRONICS (WUZHOU) / CITIZEN WATCH MANUFACTURING (THAILAND) CO., LTD. / CITIZEN SEIMITSU (THAILAND) CO., LTD. / CITIZEN SYSTEMS (DONGGUAN) CO., LTD. / CITIZEN FINEDEVICE PHILIPPINES CORP
- Target eriod: April 1, 2022 ‒ March 31, 2023
Eco-Efficiency Indicators
Please scroll down to see→
| FY2018 | FY2019 | FY2020 | FY2021 | FY2022 | |
|---|---|---|---|---|---|
| Environmental Impact Sales Index = Net Sales / Environmental Impact* | 2.9 | 2.7 | 2.3 | 2.8 | 3.5 |
- * Environmental impact is the CO2 emissions of environmental conservation effects.
Costs related to the climate change response
| Investment | Costs |
|---|---|
| 115.1 | 184.2 |
Costs related to water-related risks
| Investment | Costs |
|---|---|
| 0.0 | 221.1 |
Costs related to pollution, waste, and resource use
| Investment | Costs |
|---|---|
| 0.0 | 135.3 |
Environment-related accidents, violations
| Serious violations of environment-related laws and regulations | An environmental incident with significant impacts outside the premises. |
|---|---|
| 0 | 0 |
Environmental Accounting
Please scroll down to see→
| Category | Major Areas Covered | Amount Invested | Amount of Costs | |
|---|---|---|---|---|
| Business Area Costs | 115 | 565 | ||
| Breakdown | 1. Pollution Prevention Costs | Air Pollution, Water Pollution, Noise Prevention | 0 | 246 |
| 2. Global Environmental Conservation Costs | Energy Conservation | 115 | 184 | |
| 3. Resource Circulation Costs | Reducing Waste Generated, Recycling, Effective Use of Water | 0 | 135 | |
| Upstream/Downstream Costs | Recycling of Containers and Packaging, Use of ECOMARK | 0 | 10 | |
| Management Overhead Costs | Environmental Education, Operation of Environmental Management System, In-house Greening/Beautification | 0 | 208 | |
| R&D Costs | Solar-Powered Watch, R&D of Basic Watch Technologies | 16 | 160 | |
| Social Activity Costs | Social Contribution Activities | 0 | 3 | |
| Environmental Remediation Costs | Survey of Soil Pollution, Purification of Soil | 0 | 1 | |
| Total | 131 | 947 | ||
Please scroll down to see→
| Effects | Indicators of Environmental Conservation Effectiveness | Unit | FY2021 | FY2022 | Increase or Decrease | |
|---|---|---|---|---|---|---|
| Category of Indicators | ||||||
| (1) Effects on the Cost of the Business Area | [1] Effects Related to the Resources Put into Business Activities | Energy Consumption | GJ | 838,409 | 827,959 | -10,450 |
| Water Use | thousand ㎥ | 1,209 | 1,219 | 10 | ||
| Amount of Substances Handled that are Subject to the PRTR Act | t | 145 | 125 | -20 | ||
| [2] Effects Related to the Environmental Impact and the Waste Generated by Business Activities | CO2 Emissions | t-CO2 | 84,007 | 67,889 | -16,118 | |
| Water Discharge | thousand ㎥ | 926 | 916 | -10 | ||
| Total Waste | t | 5,090 | 5,188 | 97 | ||
| Recycled Waste | t | 5,080 | 5,178 | 98 | ||
| (2) Effects on Upstream/Downstream Costs | [3] Effects Related to the Goods and Services Produced by Business Activities | Amount of plastic containers and packaging used | t | 119 | 135 | 16 |
| Amount of paper containers and packaging used | t | 154 | 148 | -6 | ||
Please scroll down to see→
| Description of the Effects | Amount | |
|---|---|---|
| Revenue | Business Income from Selling Valuables as Part of Business Activities | 433 |
| Cost Reduction | Reduction of Energy due to Energy Conservation Activities | 136 |
| Reduction of Water Costs and Discharge Treatment Costs due to Resource Conservation Activities | 20 | |
| Reduction of Waste Treatment Costs Associated with Resource Conservation or Recycling | 5 | |
| Others | 0 | |
| Total | 594 | |
Environmental Data by Business Site
Environmental Impact Status of Group Companies in Japan
- * GHG emissions data by site is market-based standards of Scope 1 and Scope 2.
- * Some items may be combined and reported in other offices.
Please scroll down to see→
| CITIZEN WATCH (Tokyo Office) | |
|---|---|
| ■ Location | Nishitokyo-shi, Tokyo |
| ■ Description of Business | Formulation and promotion of group management strategies as a holding company, auditing of group management, management of group technology development, intellectual property, etc. |
| Energy Consumption (GJ) | 32,993 |
| Water (thousand ㎥) | 27.4 |
| PRTR Act Substances (tons) | |
| GHG Emissions (t-CO2) | 640 |
| Water Discharge (thousand ㎥) | 13.4 |
| Total Waste (tons) | 66 |
| Recycled Waste (tons) | 66 |
Please scroll down to see→
| CITIZEN WATCH (Tokorozawa Office) | |
|---|---|
| ■ Location | Tokorozawa-shi, Saitama |
| ■ Description of Business | |
| Energy Consumption (GJ) | 29,568 |
| Water (thousand ㎥) | 17.6 |
| PRTR Act Substances (tons) | |
| GHG Emissions (t-CO2) | 963 |
| Water Discharge (thousand ㎥) | 16.0 |
| Total Waste (tons) | |
| Recycled Waste (tons) | |
Please scroll down to see→
| CITIZEN SYSTEMS JAPAN (Headquarters) | |
|---|---|
| ■ Location | Nishitokyo-shi, Tokyo |
| ■ Description of Business | Information equipment products, health equipment products |
| Energy Consumption (GJ) | 1,211 |
| Water (thousand ㎥) | 1.9 |
| PRTR Act Substances (tons) | |
| GHG Emissions (t-CO2) | 0 |
| Water Discharge (thousand ㎥) | 1.8 |
| Total Waste (tons) | |
| Recycled Waste (tons) | |
Please scroll down to see→
| CITIZEN SYSTEMS JAPAN (Fujiyoshida Plant) | |
|---|---|
| ■ Location | Fujiyoshida-shi, Yamanashi |
| ■ Description of Business | Information equipment products |
| Energy Consumption (GJ) | 970 |
| Water (thousand ㎥) | 0.8 |
| PRTR Act Substances (tons) | |
| GHG Emissions (t-CO2) | 77 |
| Water Discharge (thousand ㎥) | 0.8 |
| Total Waste (tons) | 21 |
| Recycled Waste (tons) | 21 |
Please scroll down to see→
| CITIZEN MACHINERY (Karuizawa Headquarters) | |
|---|---|
| ■ Location | Miyota-machi, Kitasaku-gun, Nagano |
| ■ Description of Business | CNC automatic lathes |
| Energy Consumption (GJ) | 58,405 |
| Water (thousand ㎥) | 8.9 |
| PRTR Act Substances (tons) | 1.66 |
| GHG Emissions (t-CO2) | 5,348 |
| Water Discharge (thousand ㎥) | 7.7 |
| Total Waste (tons) | 540 |
| Recycled Waste (tons) | 539 |
Please scroll down to see→
| CITIZEN MACHINERY (Kitakami Works) | |
|---|---|
| ■ Location | Kitakami-shi, Iwate |
| ■ Description of Business | CNC automatic lathes |
| Energy Consumption (GJ) | 13,864 |
| Water (thousand ㎥) | 4.6 |
| PRTR Act Substances (tons) | 3.16 |
| GHG Emissions (t-CO2) | 1,480 |
| Water Discharge (thousand ㎥) | 4.6 |
| Total Waste (tons) | 244 |
| Recycled Waste (tons) | 243 |
Please scroll down to see→
| CITIZEN MACHINERY (Saku Works) | |
|---|---|
| ■ Location | Saku-shi, Nagano |
| ■ Description of Business | CNC automatic lathes |
| Energy Consumption (GJ) | 10,231 |
| Water (thousand ㎥) | 3.1 |
| PRTR Act Substances (tons) | |
| GHG Emissions (t-CO2) | 1,012 |
| Water Discharge (thousand ㎥) | 3.1 |
| Total Waste (tons) | 99 |
| Recycled Waste (tons) | 99 |
Please scroll down to see→
| CITIZEN MACHINERY (Tokorozawa Office) | |
|---|---|
| ■ Location | Tokorozawa-shi, Saitama |
| ■ Description of Business | |
| Energy Consumption (GJ) | 3,243 |
| Water (thousand ㎥) | 6.3 |
| PRTR Act Substances (tons) | |
| GHG Emissions (t-CO2) | 137 |
| Water Discharge (thousand ㎥) | 5.7 |
| Total Waste (tons) | |
| Recycled Waste (tons) | |
Please scroll down to see→
| CITIZEN ELECTRONICS | |
|---|---|
| ■ Location | Fujiyoshida-shi, Yamanashi |
| ■ Description of Business | Lighting LEDs, compact chip LEDs, tactile switches, optical sensors |
| Energy Consumption (GJ) | 80,069 |
| Water (thousand ㎥) | 171.5 |
| PRTR Act Substances (tons) | |
| GHG Emissions (t-CO2) | 8,391 |
| Water Discharge (thousand ㎥) | 111.5 |
| Total Waste (tons) | 63 |
| Recycled Waste (tons) | 63 |
Please scroll down to see→
| CITIZEN FINEDEVICE (Kawaguchiko Plant), FUJIMI | |
|---|---|
| ■ Location | Fujikawaguchiko-machi, Minamitsuru-gun, Yamanashi |
| ■ Description of Business | Automotive components, measuring instruments, Industrial machinery and equipment |
| Energy Consumption (GJ) | 106,611 |
| Water (thousand ㎥) | 333.4 |
| PRTR Act Substances (tons) | 73.06 |
| GHG Emissions (t-CO2) | 8,909 |
| Water Discharge (thousand ㎥) | 207.8 |
| Total Waste (tons) | 1226 |
| Recycled Waste (tons) | 1226 |
Please scroll down to see→
| CITIZEN FINEDEVICE (Miyota Works) | |
|---|---|
| ■ Location | Miyota-machi, Kitasaku-gun, Nagano |
| ■ Description of Business | Quartz Crystals/Crystal Oscillators/Crystal Wafers, Thin-Film Submounts, Ceramic Components, Watch Components, Automotive Components |
| Energy Consumption (GJ) | 69,839 |
| Water (thousand ㎥) | 94.1 |
| PRTR Act Substances (tons) | 4.61 |
| GHG Emissions (t-CO2) | 5,858 |
| Water Discharge (thousand ㎥) | 66.2 |
| Total Waste (tons) | 214 |
| Recycled Waste (tons) | 214 |
Please scroll down to see→
| CITIZEN FINEDEVICE (Kitamimaki Works) | |
|---|---|
| ■ Location | Tohmi-shi, Nagano |
| ■ Description of Business | Imaging devices, industrial machinery and equipment, small precision metal working parts |
| Energy Consumption (GJ) | 19,047 |
| Water (thousand ㎥) | 22.4 |
| PRTR Act Substances (tons) | 5.88 |
| GHG Emissions (t-CO2) | 1,700 |
| Water Discharge (thousand ㎥) | 0.0 |
| Total Waste (tons) | 35 |
| Recycled Waste (tons) | 35 |
Please scroll down to see→
| CITIZEN WATCH MANUFACTURING (Tokorozawa Head office plant) | |
|---|---|
| ■ Location | Tokorozawa-shi, Saitama |
| ■ Description of Business | Manufacture of watches and parts thereof |
| Energy Consumption (GJ) | 70,093 |
| Water (thousand ㎥) | 133.1 |
| PRTR Act Substances (tons) | 1.16 |
| GHG Emissions (t-CO2) | 1,330 |
| Water Discharge (thousand ㎥) | 119.2 |
| Total Waste (tons) | 81 |
| Recycled Waste (tons) | 81 |
Please scroll down to see→
| CITIZEN WATCH MANUFACTURING (Yubari Plant) | |
|---|---|
| ■ Location | Yubari-shi, Hokkaido |
| ■ Description of Business | Manufacture of watches and parts thereof |
| Energy Consumption (GJ) | 20,031 |
| Water (thousand ㎥) | 8.3 |
| PRTR Act Substances (tons) | 0.10 |
| GHG Emissions (t-CO2) | 2,690 |
| Water Discharge (thousand ㎥) | 8.3 |
| Total Waste (tons) | 76 |
| Recycled Waste (tons) | 76 |
Please scroll down to see→
| CITIZEN WATCH MANUFACTURING (Akita Plant) | |
|---|---|
| ■ Location | Kitaakita-shi, Akita |
| ■ Description of Business | Manufacture of watches and parts thereof |
| Energy Consumption (GJ) | 1,478 |
| Water (thousand ㎥) | 1.9 |
| PRTR Act Substances (tons) | 0.55 |
| GHG Emissions (t-CO2) | 198 |
| Water Discharge (thousand ㎥) | 0.3 |
| Total Waste (tons) | 1 |
| Recycled Waste (tons) | 1 |
Please scroll down to see→
| CITIZEN WATCH MANUFACTURING (Tohoku Kitakami Plant) | |
|---|---|
| ■ Location | Kitakami-shi, Iwate |
| ■ Description of Business | Manufacture of watches and parts thereof |
| Energy Consumption (GJ) | 49,778 |
| Water (thousand ㎥) | 208.1 |
| PRTR Act Substances (tons) | 23.09 |
| GHG Emissions (t-CO2) | 5,054 |
| Water Discharge (thousand ㎥) | 186.0 |
| Total Waste (tons) | 401 |
| Recycled Waste (tons) | 401 |
Please scroll down to see→
| CITIZEN WATCH MANUFACTURING (Tohoku Kitakami Minami Plant) | |
|---|---|
| ■ Location | Kitakami-shi, Iwate |
| ■ Description of Business | Manufacture of watches and parts thereof |
| Energy Consumption (GJ) | 9,038 |
| Water (thousand ㎥) | 11.4 |
| PRTR Act Substances (tons) | |
| GHG Emissions (t-CO2) | 1,138 |
| Water Discharge (thousand ㎥) | 11.7 |
| Total Waste (tons) | 218 |
| Recycled Waste (tons) | 218 |
Please scroll down to see→
| CITIZEN WATCH MANUFACTURING (Tohoku Nishiwaga Plant) | |
|---|---|
| ■ Location | Nishiwaga-machi, Waga-gun, Iwate |
| ■ Description of Business | Manufacture of watches and parts thereof |
| Energy Consumption (GJ) | 2,623 |
| Water (thousand ㎥) | 0.3 |
| PRTR Act Substances (tons) | 0.26 |
| GHG Emissions (t-CO2) | 303 |
| Water Discharge (thousand ㎥) | 0.3 |
| Total Waste (tons) | 7 |
| Recycled Waste (tons) | 7 |
Please scroll down to see→
| CITIZEN WATCH MANUFACTURING (Tohoku Souma Plant) | |
|---|---|
| ■ Location | Shinchi-machi, Souma-gun, Fukushima |
| ■ Description of Business | Manufacture of watches and parts thereof |
| Energy Consumption (GJ) | 4,338 |
| Water (thousand ㎥) | 1.9 |
| PRTR Act Substances (tons) | 0.98 |
| GHG Emissions (t-CO2) | 547 |
| Water Discharge (thousand ㎥) | 1.7 |
| Total Waste (tons) | 122 |
| Recycled Waste (tons) | 120 |
Please scroll down to see→
| CITIZEN WATCH MANUFACTURING (Saitama Sayama Plant) | |
|---|---|
| ■ Location | Sayama-shi, Saitama |
| ■ Description of Business | Manufacture of watches and parts thereof |
| Energy Consumption (GJ) | 19,323 |
| Water (thousand ㎥) | 10.3 |
| PRTR Act Substances (tons) | 4.80 |
| GHG Emissions (t-CO2) | 2,387 |
| Water Discharge (thousand ㎥) | 10.3 |
| Total Waste (tons) | 229 |
| Recycled Waste (tons) | 229 |
Please scroll down to see→
| CITIZEN WATCH MANUFACTURING (Saitama Yoshimi Plant) | |
|---|---|
| ■ Location | Yoshimi-machi, Hiki-gun, Saitama |
| ■ Description of Business | Manufacture of watches and parts thereof |
| Energy Consumption (GJ) | 24,774 |
| Water (thousand ㎥) | 73.5 |
| PRTR Act Substances (tons) | 1.61 |
| GHG Emissions (t-CO2) | 2,938 |
| Water Discharge (thousand ㎥) | 73.5 |
| Total Waste (tons) | 645 |
| Recycled Waste (tons) | 645 |
Please scroll down to see→
| CITIZEN WATCH MANUFACTURING (Saitama Tanashi Plant) | |
|---|---|
| ■ Location | Nishitokyo-shi, Tokyo |
| ■ Description of Business | Manufacture of watches and parts thereof |
| Energy Consumption (GJ) | 22,630 |
| Water (thousand ㎥) | 1.6 |
| PRTR Act Substances (tons) | 0.14 |
| GHG Emissions (t-CO2) | 167 |
| Water Discharge (thousand ㎥) | 0.5 |
| Total Waste (tons) | |
| Recycled Waste (tons) | |
Please scroll down to see→
| CITIZEN WATCH MANUFACTURING (Kawaguchiko Fuji Plant) | |
|---|---|
| ■ Location | Fujiyoshida-shi, Yamanashi |
| ■ Description of Business | Manufacture of watches and parts thereof |
| Energy Consumption (GJ) | 9,090 |
| Water (thousand ㎥) | 7.3 |
| PRTR Act Substances (tons) | 1.21 |
| GHG Emissions (t-CO2) | 1,137 |
| Water Discharge (thousand ㎥) | 7.3 |
| Total Waste (tons) | 39 |
| Recycled Waste (tons) | 39 |
Please scroll down to see→
| CITIZEN WATCH MANUFACTURING (Kawaguchiko CFD Plant) | |
|---|---|
| ■ Location | Fujikawaguchiko-machi, Minamitsuru-gun, Yamanashi |
| ■ Description of Business | Manufacture of watches and parts thereof |
| Energy Consumption (GJ) | 8,714 |
| Water (thousand ㎥) | |
| PRTR Act Substances (tons) | 0.83 |
| GHG Emissions (t-CO2) | 601 |
| Water Discharge (thousand ㎥) | |
| Total Waste (tons) | 16 |
| Recycled Waste (tons) | 16 |
Please scroll down to see→
| CITIZEN WATCH MANUFACTURING (Myoko Plant) | |
|---|---|
| ■ Location | Myoko-shi, Niigata |
| ■ Description of Business | Manufacture of watches and parts thereof |
| Energy Consumption (GJ) | 1,111 |
| Water (thousand ㎥) | 0.8 |
| PRTR Act Substances (tons) | |
| GHG Emissions (t-CO2) | 137 |
| Water Discharge (thousand ㎥) | 0.5 |
| Total Waste (tons) | 2 |
| Recycled Waste (tons) | 2 |
Please scroll down to see→
| CITIZEN WATCH MANUFACTURING (Miyota Saku Plant) | |
|---|---|
| ■ Location | Saku-shi, Nagano |
| ■ Description of Business | Manufacture of watches and parts thereof |
| Energy Consumption (GJ) | 37,604 |
| Water (thousand ㎥) | 19.7 |
| PRTR Act Substances (tons) | |
| GHG Emissions (t-CO2) | 3,149 |
| Water Discharge (thousand ㎥) | 10.8 |
| Total Waste (tons) | 37 |
| Recycled Waste (tons) | 37 |
Please scroll down to see→
| CITIZEN WATCH MANUFACTURING (Iida Tonooka Plant) | |
|---|---|
| ■ Location | Iida-shi, Nagano |
| ■ Description of Business | Manufacture of watches and parts thereof |
| Energy Consumption (GJ) | 13,934 |
| Water (thousand ㎥) | 6.4 |
| PRTR Act Substances (tons) | |
| GHG Emissions (t-CO2) | 1,502 |
| Water Discharge (thousand ㎥) | 6.2 |
| Total Waste (tons) | 134 |
| Recycled Waste (tons) | 133 |
Please scroll down to see→
| CITIZEN WATCH MANUFACTURING (Iida Matsuo Plant) | |
|---|---|
| ■ Location | Iida-shi, Nagano |
| ■ Description of Business | Manufacture of watches and parts thereof |
| Energy Consumption (GJ) | 6,360 |
| Water (thousand ㎥) | 1.4 |
| PRTR Act Substances (tons) | |
| GHG Emissions (t-CO2) | 682 |
| Water Discharge (thousand ㎥) | 1.4 |
| Total Waste (tons) | 0 |
| Recycled Waste (tons) | 0 |
Please scroll down to see→
| CITIZEN WATCH MANUFACTURING (Kagoshima Plant) | |
|---|---|
| ■ Location | Hioki-shi, Kagoshima |
| ■ Description of Business | Manufacture of watches and parts thereof |
| Energy Consumption (GJ) | 48,709 |
| Water (thousand ㎥) | 23.1 |
| PRTR Act Substances (tons) | 0.40 |
| GHG Emissions (t-CO2) | 4,418 |
| Water Discharge (thousand ㎥) | 21.3 |
| Total Waste (tons) | 449 |
| Recycled Waste (tons) | 449 |
Please scroll down to see→
| CITIZEN T.I.C. | |
|---|---|
| ■ Location | Koganei-shi, Tokyo |
| ■ Description of Business | Clock devices, digital signage, electronic scoreboards |
| Energy Consumption (GJ) | 2,555 |
| Water (thousand ㎥) | 0.7 |
| PRTR Act Substances (tons) | |
| GHG Emissions (t-CO2) | 196 |
| Water Discharge (thousand ㎥) | 0.7 |
| Total Waste (tons) | 37 |
| Recycled Waste (tons) | 37 |
Please scroll down to see→
| CITIZEN ELECTRONICS TIMEL (headquarters) | |
|---|---|
| ■ Location | Fujiyoshida-shi, Yamanashi |
| ■ Description of Business | Lighting LEDs, compact chip LEDs, tactile switches |
| Energy Consumption (GJ) | 4,484 |
| Water (thousand ㎥) | 1.4 |
| PRTR Act Substances (tons) | |
| GHG Emissions (t-CO2) | 433 |
| Water Discharge (thousand ㎥) | 1.4 |
| Total Waste (tons) | 10 |
| Recycled Waste (tons) | 10 |
Please scroll down to see→
| CITIZEN ELECTRONICS TIMEL (Sakaigawa plant) | |
|---|---|
| ■ Location | Fuefuki-shi, Yamanashi |
| ■ Description of Business | LEDs for lighting, Chip LEDs |
| Energy Consumption (GJ) | 23,512 |
| Water (thousand ㎥) | 13.5 |
| PRTR Act Substances (tons) | |
| GHG Emissions (t-CO2) | 2,587 |
| Water Discharge (thousand ㎥) | 13.2 |
| Total Waste (tons) | 32 |
| Recycled Waste (tons) | 29 |
Please scroll down to see→
| CITIZEN CHIBA PRECISION | |
|---|---|
| ■ Location | Yachiyo-shi, Chiba |
| ■ Description of Business | Brushless motors, linear actuators, coreless DC servomotors |
| Energy Consumption (GJ) | 1,377 |
| Water (thousand ㎥) | 1.0 |
| PRTR Act Substances (tons) | |
| GHG Emissions (t-CO2) | 180 |
| Water Discharge (thousand ㎥) | 0.9 |
| Total Waste (tons) | 29 |
| Recycled Waste (tons) | 26 |
Please scroll down to see→
| CITIZEN MICRO (Hidaka head office plant) | |
|---|---|
| ■ Location | Hidaka-shi, Saitama |
| ■ Description of Business | Micro reduction gears, micro motors |
| Energy Consumption (GJ) | 2,153 |
| Water (thousand ㎥) | 0.9 |
| PRTR Act Substances (tons) | 1.15 |
| GHG Emissions (t-CO2) | 284 |
| Water Discharge (thousand ㎥) | 0.9 |
| Total Waste (tons) | 16 |
| Recycled Waste (tons) | 16 |
Please scroll down to see→
| CITIZEN MICRO (Chichibu plant) | |
|---|---|
| ■ Location | Chichibu-shi, Saitama |
| ■ Description of Business | |
| Energy Consumption (GJ) | 421 |
| Water (thousand ㎥) | 0.3 |
| PRTR Act Substances (tons) | |
| GHG Emissions (t-CO2) | 55 |
| Water Discharge (thousand ㎥) | 0.3 |
| Total Waste (tons) | 6 |
| Recycled Waste (tons) | 6 |
Please scroll down to see→
| CITIZEN LOGISTICS SERVICE | |
|---|---|
| ■ Location | Kawajima-machi, Hiki-gun, Saitama |
| ■ Description of Business | Logistics of watches and promotional materials |
| Energy Consumption (GJ) | 862 |
| Water (thousand ㎥) | 0.5 |
| PRTR Act Substances (tons) | |
| GHG Emissions (t-CO2) | 125 |
| Water Discharge (thousand ㎥) | 0.5 |
| Total Waste (tons) | 94 |
| Recycled Waste (tons) | 94 |
Environmental Impact Status of Group Companies Outside Japan
- Reporting period: April 1, 2022 - March31, 2023
- Reporting scope: 13 sites outside Japan
Please scroll down to see→
| ROYAL TIME CITI CO., LTD. | |
|---|---|
| ■ Location | Thailand |
| ■ Description of Business | Manufacture of watches and parts thereof |
| Energy Consumption (GJ) | 23,033 |
| Water (thousand ㎥) | 29.1 |
| Chemical Substance Usage (tons) | 106.71 |
| GHG Emissions (t-CO2) | 2,622 |
| Water Discharge (thousand ㎥) | 0.3 |
| Total Waste (tons) | 585 |
| Recycled Waste (tons) | 585 |
Please scroll down to see→
| CITIZEN WATCH MANUFACTURING (THAILAND) CO., LTD. | |
|---|---|
| ■ Location | Thailand |
| ■ Description of Business | Manufacture of watches and parts thereof |
| Energy Consumption (GJ) | 26,045 |
| Water (thousand ㎥) | 96.9 |
| Chemical Substance Usage (tons) | 120.89 |
| GHG Emissions (t-CO2) | 3,590 |
| Water Discharge (thousand ㎥) | 77.5 |
| Total Waste (tons) | 349 |
| Recycled Waste (tons) | 235 |
Please scroll down to see→
| GUANGZHOU MOST CROWN ELECTRONICS LTD. | |
|---|---|
| ■ Location | China |
| ■ Description of Business | Manufacture of watches and parts thereof |
| Energy Consumption (GJ) | 19,520 |
| Water (thousand ㎥) | 69.2 |
| Chemical Substance Usage (tons) | 0.85 |
| GHG Emissions (t-CO2) | 2,433 |
| Water Discharge (thousand ㎥) | 65.0 |
| Total Waste (tons) | 934 |
| Recycled Waste (tons) | 914 |
Please scroll down to see→
| CITIZEN MACHINERY ASIA CO.,LTD. | |
|---|---|
| ■ Location | Thailand |
| ■ Description of Business | CNC automatic lathe |
| Energy Consumption (GJ) | 29,335 |
| Water (thousand ㎥) | 22.3 |
| Chemical Substance Usage (tons) | 52.45 |
| GHG Emissions (t-CO2) | 3,627 |
| Water Discharge (thousand ㎥) | 17.8 |
| Total Waste (tons) | 374 |
| Recycled Waste (tons) | 299 |
Please scroll down to see→
| CITIZEN MACHINERY VIETNAM CO.,LTD. | |
|---|---|
| ■ Location | Vietnam |
| ■ Description of Business | |
| Energy Consumption (GJ) | 26,686 |
| Water (thousand ㎥) | 10.0 |
| Chemical Substance Usage (tons) | 572.35 |
| GHG Emissions (t-CO2) | 4,147 |
| Water Discharge (thousand ㎥) | 8.0 |
| Total Waste (tons) | 1,093 |
| Recycled Waste (tons) | 1,059 |
Please scroll down to see→
| CITIZEN MACHINERY PHILIPPINES INC. | |
|---|---|
| ■ Location | Philippines |
| ■ Description of Business | CNC automatic lathe |
| Energy Consumption (GJ) | 32,477 |
| Water (thousand ㎥) | 17.9 |
| Chemical Substance Usage (tons) | 87.72 |
| GHG Emissions (t-CO2) | 1,708 |
| Water Discharge (thousand ㎥) | 15.2 |
| Total Waste (tons) | 1,144 |
| Recycled Waste (tons) | 426 |
Please scroll down to see→
| CITIZEN (CHINA) PRECISION MACHINERY CO., LTD. | |
|---|---|
| ■ Location | China |
| ■ Description of Business | CNC automatic lathe |
| Energy Consumption (GJ) | 24,689 |
| Water (thousand ㎥) | 14.4 |
| Chemical Substance Usage (tons) | 8.86 |
| GHG Emissions (t-CO2) | 3,280 |
| Water Discharge (thousand ㎥) | 14.4 |
| Total Waste (tons) | 405 |
| Recycled Waste (tons) | 333 |
Please scroll down to see→
| JIANGXING ELECTRONICS LTD. | |
|---|---|
| ■ Location | China |
| ■ Description of Business | |
| Energy Consumption (GJ) | 65,923 |
| Water (thousand ㎥) | 70.8 |
| Chemical Substance Usage (tons) | 18.03 |
| GHG Emissions (t-CO2) | 13,822 |
| Water Discharge (thousand ㎥) | 10.9 |
| Total Waste (tons) | 63 |
| Recycled Waste (tons) | 38 |
Please scroll down to see→
| MASTER CROWN ELECTRONICS (WUZHOU) Ltd. | |
|---|---|
| ■ Location | China |
| ■ Description of Business | Quartz Crystals/Crystal Oscillators, Imaging Devices, Ceramic Components |
| Energy Consumption (GJ) | 37,416 |
| Water (thousand ㎥) | 37.8 |
| Chemical Substance Usage (tons) | 22.10 |
| GHG Emissions (t-CO2) | 6,044 |
| Water Discharge (thousand ㎥) | 1.5 |
| Total Waste (tons) | 24 |
| Recycled Waste (tons) | 11 |
Please scroll down to see→
| CITIZEN FINEDEVICE PHILIPPINES CORP. | |
|---|---|
| ■ Location | Philippines |
| ■ Description of Business | Quartz Crystals/Crystal Oscillators/Crystal Wafers, Precision Measuring Instruments |
| Energy Consumption (GJ) | 37,866 |
| Water (thousand ㎥) | 118.9 |
| Chemical Substance Usage (tons) | 37.64 |
| GHG Emissions (t-CO2) | 6,866 |
| Water Discharge (thousand ㎥) | 101.6 |
| Total Waste (tons) | 360 |
| Recycled Waste (tons) | 329 |
Please scroll down to see→
| CITIZEN SEIMITSU (THAILAND) CO., LTD. | |
|---|---|
| ■ Location | Thailand |
| ■ Description of Business | Automobile parts |
| Energy Consumption (GJ) | 36,087 |
| Water (thousand ㎥) | 39.9 |
| Chemical Substance Usage (tons) | 210.54 |
| GHG Emissions (t-CO2) | 4,914 |
| Water Discharge (thousand ㎥) | 31.9 |
| Total Waste (tons) | 481 |
| Recycled Waste (tons) | 419 |
Please scroll down to see→
| CITIZEN SYSTEMS (JIANGMEN) CO., LTD. | |
|---|---|
| ■ Location | China |
| ■ Description of Business | Information equipment products, health equipment products |
| Energy Consumption (GJ) | 10,003 |
| Water (thousand ㎥) | 12.7 |
| Chemical Substance Usage (tons) | 6.69 |
| GHG Emissions (t-CO2) | 1,290 |
| Water Discharge (thousand ㎥) | 11.1 |
| Total Waste (tons) | 133 |
| Recycled Waste (tons) | 59 |
Please scroll down to see→
| CITIZEN SYSTEMS (DONGGUAN) CO., LTD. | |
|---|---|
| ■ Location | China |
| ■ Description of Business | Information equipment products, health equipment products |
| Energy Consumption (GJ) | 11,937 |
| Water (thousand ㎥) | 23.0 |
| Chemical Substance Usage (tons) | 2.71 |
| GHG Emissions (t-CO2) | 2,060 |
| Water Discharge (thousand ㎥) | 12.8 |
| Total Waste (tons) | 43 |
| Recycled Waste (tons) | 43 |
Disclosure Information
Social
Basic data
Please scroll down to see→
| FY2018 | FY2019 | FY2020 | FY2021 | FY2022 | |
|---|---|---|---|---|---|
| Regular employees | - | - | - | 4354 | 4358 |
| Contract employees (working full time) | - | - | - | 656 | 627 |
| Part-time employees (working less than full-time) | - | - | - | 44 | 46 |
| Elder partners (retirees, including employees working less than full-time) | - | - | - | 250 | 316 |
Please scroll down to see→
| FY2018 | FY2019 | FY2020 | FY2021 | FY2022 | |
|---|---|---|---|---|---|
| Male | 42.8 | 42.6 | 42.1 | 42.6 | 43.1 |
| Female | 40.0 | 39.6 | 38.7 | 41.0 | 40.3 |
| Total | 42.3 | 42.0 | 41.4 | 42.9 | 42.5 |
Please scroll down to see→
| FY2018 | FY2019 | FY2020 | FY2021 | FY2022 | |
|---|---|---|---|---|---|
| Male | 18.4 | 18.6 | 18.2 | 18.2 | 18.4 |
| Female | 16.6 | 16.3 | 15.1 | 15.8 | 15.4 |
| Total | 18.1 | 18.1 | 17.6 | 17.7 | 17.8 |
Please scroll down to see→
| FY2018 | FY2019 | FY2020 | FY2021 | FY2022 | |
|---|---|---|---|---|---|
| Male | 76 | 91 | 56 | 22 | 35 |
| Female | 39 | 36 | 23 | 2 | 8 |
| Total | 115 | 127 | 79 | 24 | 43 |
Please scroll down to see→
| FY2018 | FY2019 | FY2020 | FY2021 | FY2022 | |
|---|---|---|---|---|---|
| Male | 53 | 14 | 6 | 12 | 38 |
| Female | 9 | 3 | 0 | 2 | 19 |
| Total | 62 | 17 | 6 | 14 | 57 |
Please scroll down to see→
| FY2018 | FY2019 | FY2020 | FY2021 | FY2022 | |
|---|---|---|---|---|---|
| 10s | 1 | 5 | 3 | 0 | 1 |
| 20s | 34 | 31 | 60 | 51 | 43 |
| 30s | 24 | 26 | 56 | 34 | 34 |
| 40s | 15 | 14 | 10 | 21 | 19 |
| 50s | 16 | 12 | 18 | 12 | 8 |
| 60s | 2 | 8 | 0 | 0 | 1 |
| Total | 92 | 96 | 147 | 118 | 106 |
Please scroll down to see→
| FY2018 | FY2019 | FY2020 | FY2021 | FY2022 | |
|---|---|---|---|---|---|
| Male | 63 | 68 | 113 | 93 | 80 |
| Female | 29 | 28 | 34 | 25 | 26 |
| Total | 92 | 96 | 147 | 118 | 106 |
Please scroll down to see→
| FY2018 | FY2019 | FY2020 | FY2021 | FY2022 | |
|---|---|---|---|---|---|
| Total | 2.02% | 1.88% | 3.25% | 2.71% | 2.43% |
Promoting Diversity
Please scroll down to see→
| FY2018 | FY2019 | FY2020 | FY2021 | FY2022 | |
|---|---|---|---|---|---|
| Employees | 19.0% | 20.4% | 20.1% | 20.3% | 21.5% |
| Management staff | 3.6% | 3.7% | 4.4% | 4.8% | 5.7% |
| Officers | 2.8% | 5.6% | 11.8% | 12.1% | 11.1% |
- * Officers are defined as directors and auditors.
Please scroll down to see→
| FY2018 | FY2019 | FY2020 | FY2021 | FY2022 | |
|---|---|---|---|---|---|
| Employees | 25.1% | 25.6% | 26.0% | 26.8% | 28.0% |
| Management staff | 6.5% | 6.6% | 7.0% | 7.5% | 8.6% |
| Officers | 7.7% | 14.3% | 15.4% | 16.7% | 16.7% |
- * Officers are defined as directors and auditors.
Please scroll down to see→
| FY2018 | FY2019 | FY2020 | FY2021 | FY2022 | |
|---|---|---|---|---|---|
| Total | 2.08% | 2.15% | 2.12% | 2.03% | 2.14% |
Promoting a Work-Life Balance
Please scroll down to see→
| FY2018 | FY2019 | FY2020 | FY2021 | FY2022 | |
|---|---|---|---|---|---|
| Male | 6 | 18 | 20 | 25 | 33 |
| Female | 32 | 44 | 27 | 32 | 35 |
| Total | 38 | 62 | 47 | 57 | 68 |
- * In addition to childcare leave, our regular employees receive benefits such as life insurance, medical disability and occupational illness compensation, the company's retirement package, and an employee stock ownership plan
Please scroll down to see→
| FY2018 | FY2019 | FY2020 | FY2021 | FY2022 | |
|---|---|---|---|---|---|
| Total | 86 | 108 | 65 | 74 | 92 |
Please scroll down to see→
| FY2018 | FY2019 | FY2020 | FY2021 | FY2022 | |
|---|---|---|---|---|---|
| Total | 4 | 0 | 0 | 1 | 0 |
Please scroll down to see→
| FY2018 | FY2019 | FY2020 | FY2021 | FY2022 | |
|---|---|---|---|---|---|
| Total | - | - | - | 100.0% | 100.0% |
Please scroll down to see→
| FY2018 | FY2019 | FY2020 | FY2021 | FY2022 | |
|---|---|---|---|---|---|
| Total | - | - | - | 68.2% | 76.9% |
Human Capital Development
Please scroll down to see→
| FY2018 | FY2019 | FY2020 | FY2021 | FY2022 | |
|---|---|---|---|---|---|
| Average training hours per employee | 4.2 | 4.2 | 5.9 | 5.5 | 9.1 |
| Company total | 20,019 | 20,963 | 26,272 | 23,556 | 39,260 |
Occupational Health and Safety
Please scroll down to see→
| FY2018 | FY2019 | FY2020 | FY2021 | FY2022 | |
|---|---|---|---|---|---|
| Fatal accidents | 0 | 0 | 0 | 0 | 0 |
| Accidents | 8 | 5 | 6 | 3 | 9 |
Please scroll down to see→
| FY2018 | FY2019 | FY2020 | FY2021 | FY2022 | |
|---|---|---|---|---|---|
| Programs | 261 | - | 45 | 83 | 98 |
| Eligible employees | 6,411 | 8,273 | 3,000 | 1,429 | 1,380 |
Please scroll down to see→
| FY2018 | FY2019 | FY2020 | FY2021 | FY2022 | |
|---|---|---|---|---|---|
| Lost time injury frequency rate (LTIFR) | 0.28 | 0.00 | 2.26 | 2.38 | 2.19 |
| Lost time injury severity rate (LTISR) | 0.00 | 0.00 | 0.01 | 0.00 | 0.05 |
- * [0.00] means a figure that is less than 0.01 even after being rounded to the third decimal place.
Please scroll down to see→
| Subject to | FY2018 | FY2019 | FY2020 | FY2021 | FY2022 | FY2023 (Target) |
|
|---|---|---|---|---|---|---|---|
| Specified medical checkup rate | Insured and family | 85.3% | 86.1% | 84.3% | 85.6% | 87.3% | 85.0% |
| Rate of metabolic syndrome diagnosed | Insured and family | 12.8% | 13.7% | 15.2% | 13.6% | 13.9% | 12.9% |
| (Compared to FY2008) | (+14.2%) | (+23.0%) | (+36.1%) | (+21.6%) | (+24.7%) | (+15.6%) | |
| Rate of pre-metabolic syndrome diagnosed | Insured and family | 12.4% | 13.1% | 14.0% | 13.7% | 12.6% | 13.0% |
| (Compared to FY2008) | (+13.6%) | (+19.9%) | (+28.4%) | (+25.5%) | (+15.2%) | (+19.2%) | |
| Rate of specific health guidance provided | Insured and family | 40.3% | 31.7% | 23.3% | 64.0% | 64.6% | 60.0% |
- (As of October 30, 2023)
Social Contribution Activity Expenses
| FY2022 | |
|---|---|
| Social welfare | 3,011 |
| Employment creation | 1,058 |
| Health and sports | 16,759 |
| Academic research | 158 |
| Education | 21,479 |
| Culture and arts | 1,460 |
| Environment | 4,045 |
| Community activities | 27,704 |
| International exchange | 0 |
| Disaster assistance | 5,100 |
| Others | 11,318 |
| Total | 92,091 |
- * Due to rounding, the total for each item may not equal the total.
| FY2022 | |
|---|---|
| Monetary donations | 33,986 |
| In-kind donations | 2,211 |
| Making company | 15,692 |
| Involvement by employees | 27,135 |
| Others | 13,066 |
| Total | 92,091 |
- * Due to rounding, the total for each item may not equal the total.
| FY2022 | |
|---|---|
| Social Contribution Mission Program | 0 |
| Instructor for the watchmaking workshop | 37 |
| Cleanup activities | 2,058 |
| FY2022 | |
|---|---|
| Social welfare | 0 |
Others
| FY2022 | |
|---|---|
| Domestic | 6,511 |
| China | 4,376 |
| Thailand | 1,954 |
| Philippines | 761 |
| Europe | 757 |
| U.S. | 529 |
| Others | 514 |
| Total | 15,402 |
| FY2022 | |
|---|---|
| Domestic | 1,805 |
| Overseas | 1,472 |